 Outpost Docs
Dashboard Overview
The Outpost dashboard is the admin console for the whole platform, with live stats, drill-downs, and configuration for every tenant.
The Outpost dashboard is a web console for Outpost administrators. Where the API gives each tenant a scoped view of their own data, the dashboard shows the whole platform: every tenant, project, campaign, phone number, and dollar spent, in one place.
It runs at dashboard.<environment>.outpost.24g.dev (for example dashboard.prod.outpost.24g.dev) and signs you in with your 24G single sign-on account.
What each section covers
The left navigation mirrors the platform's core concepts:
| Section | What you do there | Concept behind it |
|---|---|---|
| Dashboard | System-wide stats, recent activity, and a Quick Send form | Stats & Analytics |
| Campaigns | Browse campaign folders and their aggregate performance | Communications & Campaigns |
| Communications | Review individual broadcast sends and their recipients | Communications & Campaigns |
| Phone Numbers | Inspect any recipient phone: validation, opt-out state, history | Phones & Opt-Out |
| Number Pool | View the AWS number pool Outpost sends from | Messages |
| Tenants | Create and manage tenants, projects, API keys, and webhooks | Tenants & Projects |
The home page
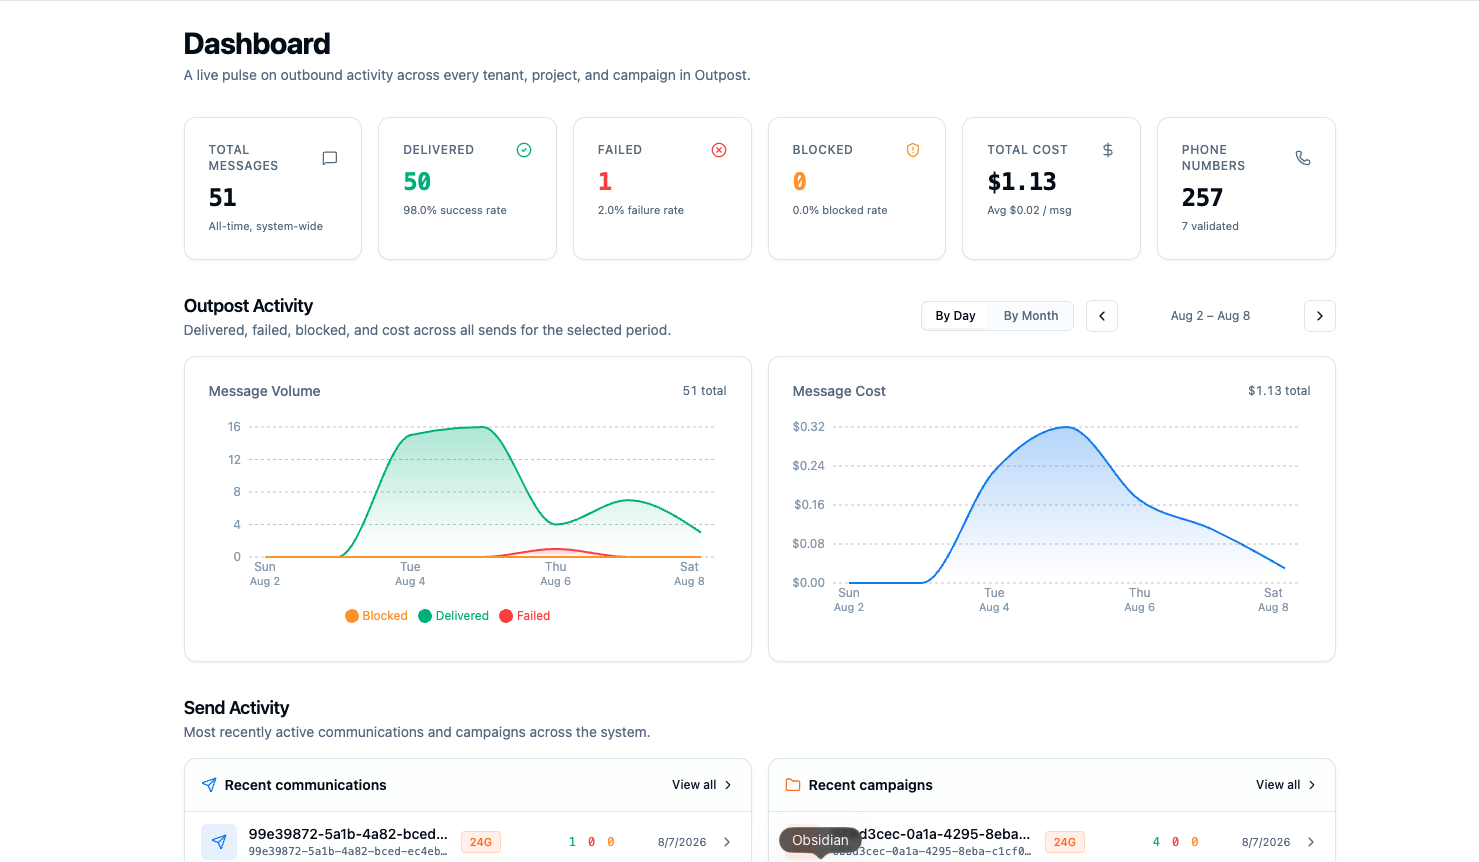
The home page is a live pulse on outbound activity:
- Stat cards: all-time totals for messages, delivered, failed, blocked, cost, and known phone numbers.
- Outpost Activity: message volume and cost charts for a selected window, switchable between By Day and By Month.
- Send Activity: the most recently active communications and campaigns across the system, each linking to its detail page.
- Audience Health: opt-out rate across all phones and a summary of the number pool.
How-to guides
- Managing Tenants & Projects: create tenants and projects, issue API keys, configure compliance and webhooks.
- Sending & Tracking Messages: use Quick Send and follow a broadcast down to each recipient.
- Phones & the Number Pool: inspect a phone's full history and the sending-number inventory.